Showing posts with label Info Graphics. Show all posts

Sunday, 5 June 2011

Intel's Museum of Me

First there was the Facebook Book, and now we can view our social media content in the form of a virtual museum exhibition...

Created by Japanese agency Projector Inc (which was behind the hugely successfulUniqlock website), The Museum of Me is a campaign for Intel. It works by sucking in all your info from Facebook and turning it into an online exhibit.

The online show opens with title text bearing the user's name, and then an opening line, describing the show as "a journey of visualization that explores who I am" (appropriately enough, the designers seem to have supped from the fountain of artspeak before coming up with that description).

The exhibition then begins with galleries of images of your friends, and of photos you have uploaded. Virtual people are shown walking around the space and examining your personal imagery with due reverence. Later in the exhibit, there is a text installation, constructed from words found on your wall. Obviously, as with all aspects of the exhibition, the more stuff you have on your Facebook profile, the richer the show will be (my text wall seems to feature the words 'happy birthday' and 'lovely' a lot, highlighting my lack of imagination on the site).

Later a number of robot arms chuck images around a room, before the exhibition ends with a web of photos of your friends, with you in the centre. The site then offers you the chance to share your museum exhibit back on Facebook. The Museum of Me does raise a few concerns about privacy, which have obviously already been anticipated: the opening page states that Intel will not keep any of the content it takes onto the site, and won't use it anywhere else. It is nonetheless unnerving to see all your images so easily appearing somewhere other than Facebook, but this only goes to prove that anything placed on such sites is never really that private. Mostly though, the Museum of Me is a fun way of viewing your social media content. Check it out at museumofme.intel.com.


Saturday, 9 April 2011

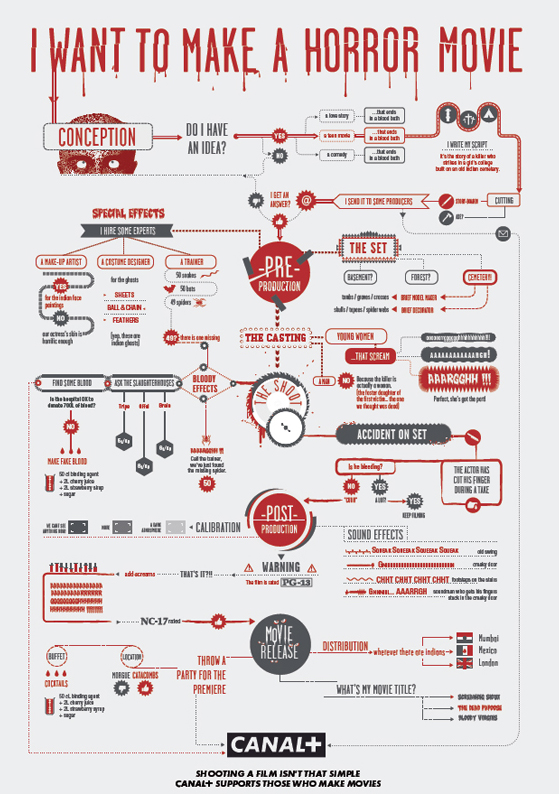
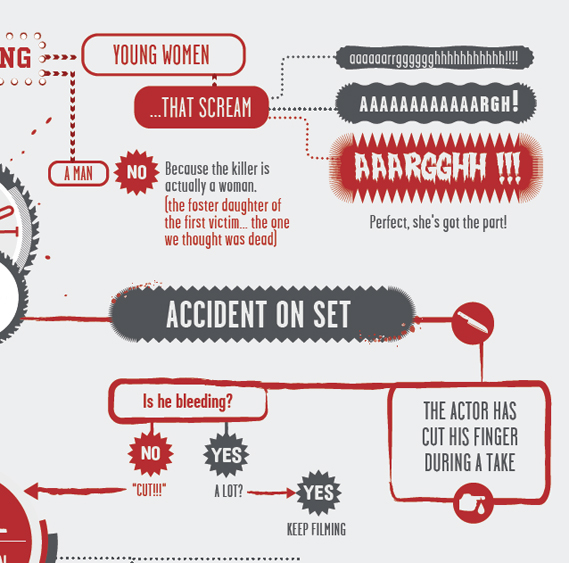
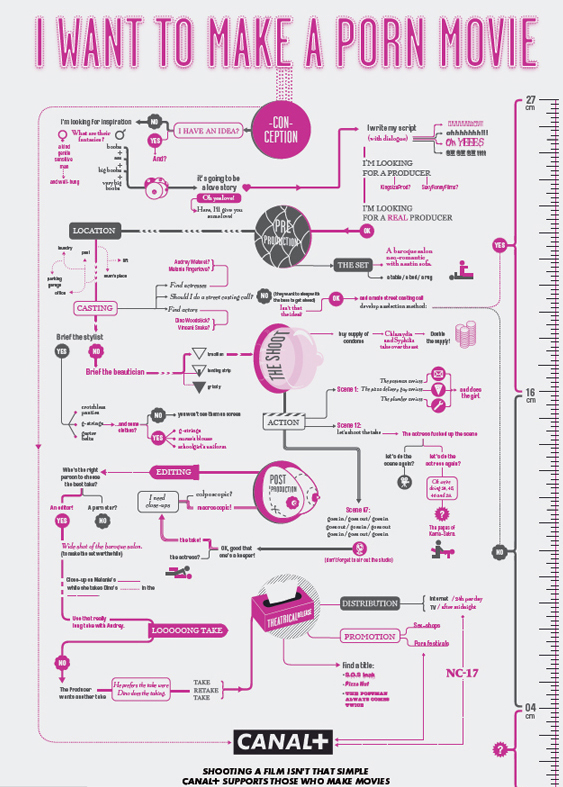
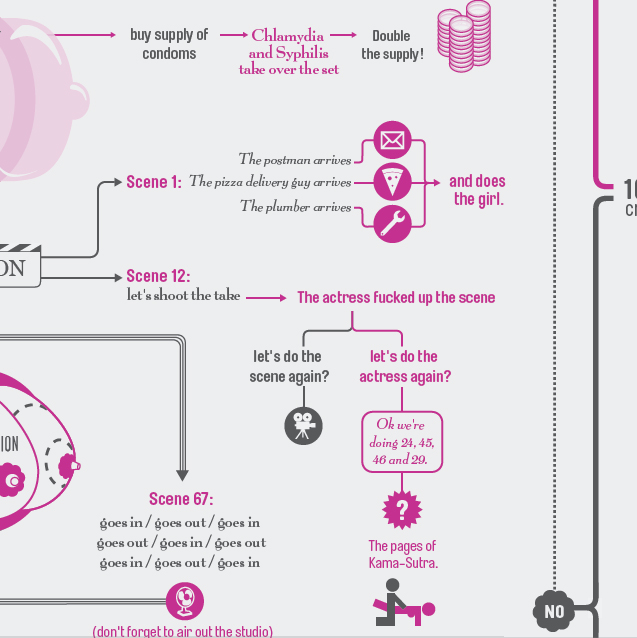
Canal+ shows how to get ahead in the movies

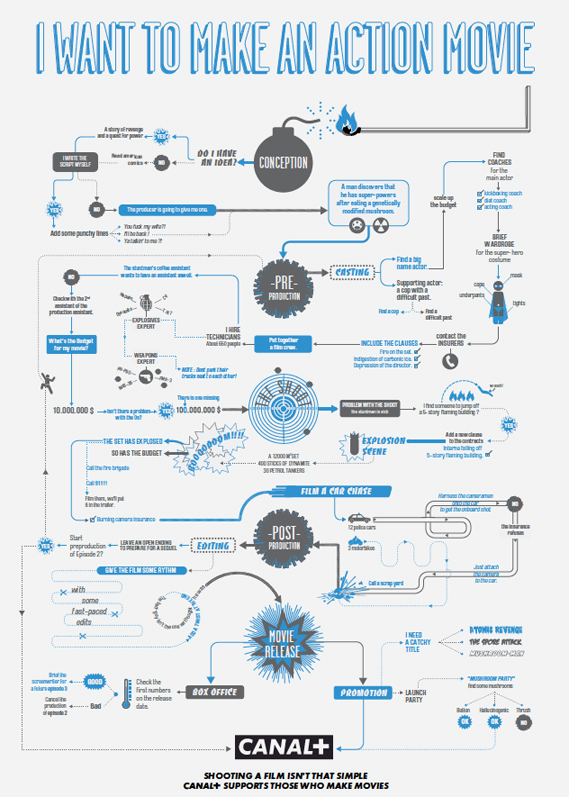
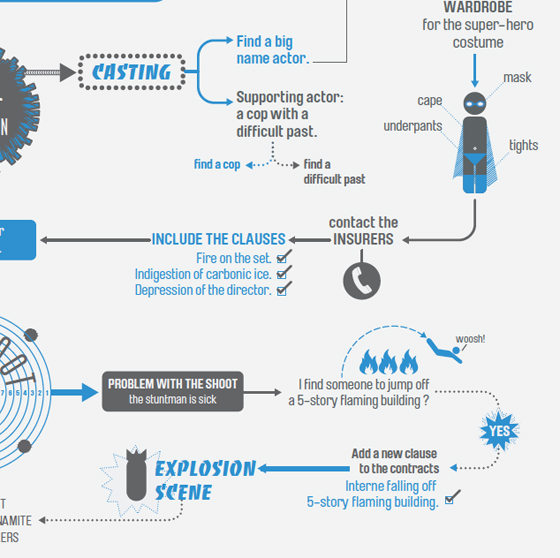
French TV channel Canal+ has a released a witty series of ads, devised by BETC Euro RSCG in Paris, that emphasise its commitment to helping filmmakers...The ads use beautifully designed flowcharts (inspired by New York magazine, perhaps?) to highlight the many twists and turns that can occur when making a movie, and some of the solutions. Each one tackles a different genre, including action, horror and porn, and feature many amusing outcomes. Shown below are three of the full ads, alongside details of each.


Credits:
Agency: BETC Euro RSCG
Global creative director: Stéphane Xiberras
Creative director: Olivier Apers
Creatives: Gregory Ferembach, David Troquier
Illustrator: Les Graphiquants


Sunday, 21 November 2010

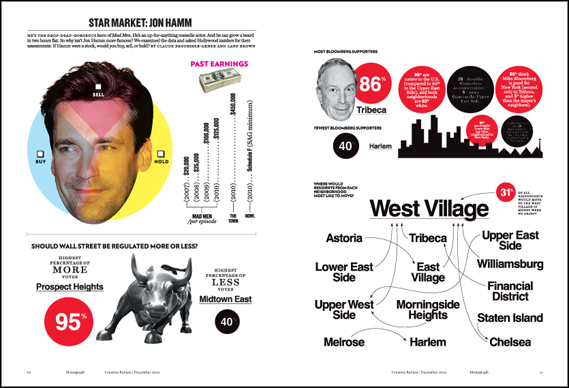
New York magazine: data done right

I always feel jealous when I see a copy of New York magazine, jealous that my own country's capital city, London, doesn't have such an intelligent, funny and well-designed equivalent title to document its life and times.
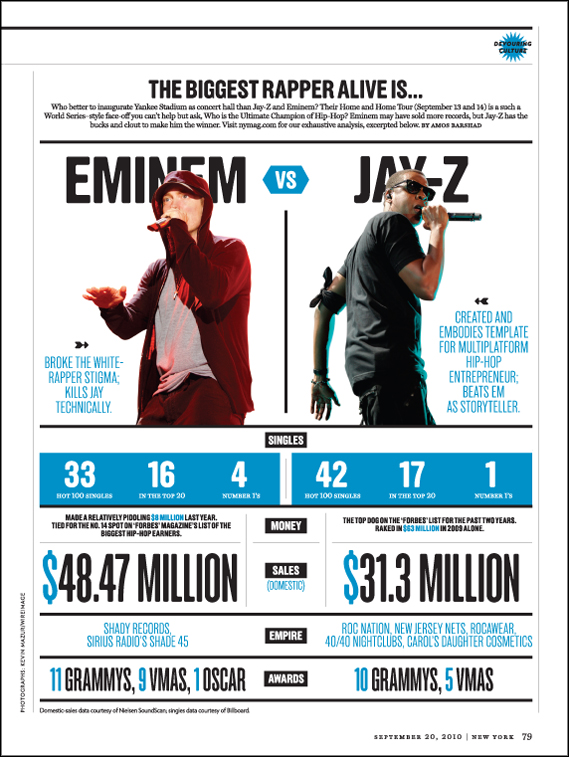
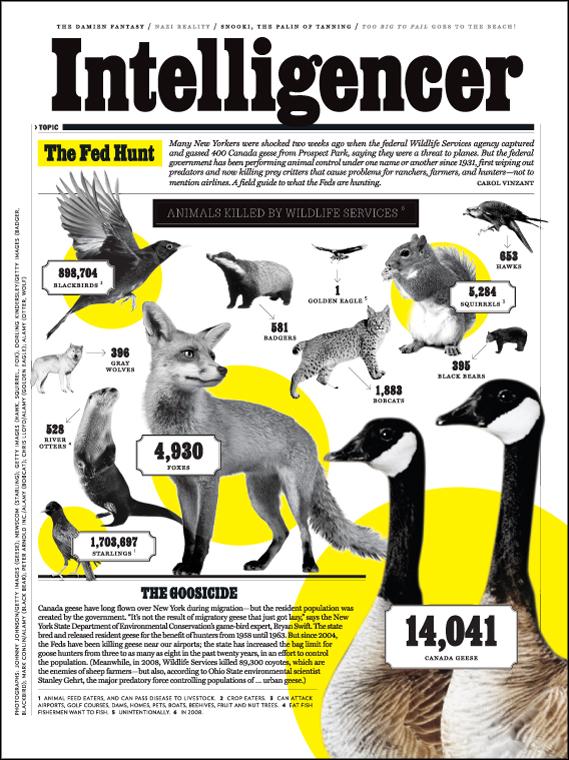
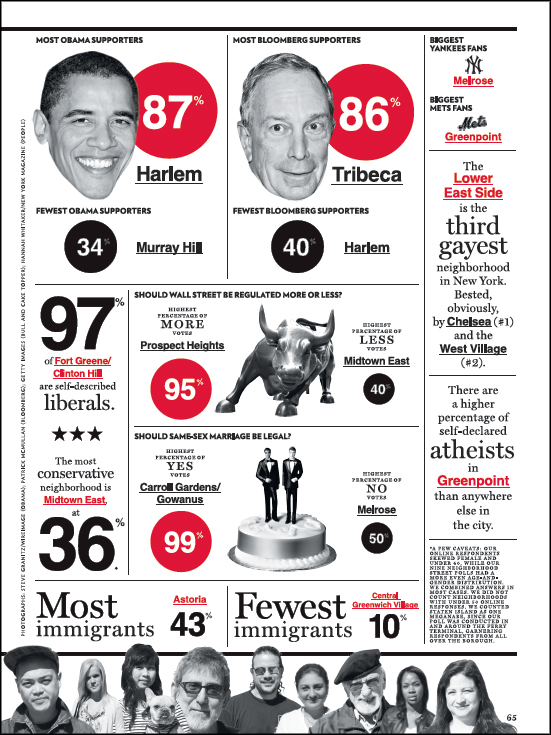
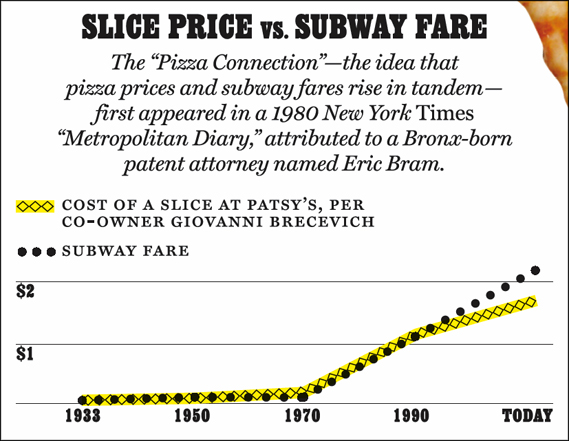
There are lots of things that New York does well, but the thing it does best is its infographics. After Information is Beautiful's David McCandless had his infamous set-to with Neville Brody on Newsnight, the role of infographics has been increasingly questioned: many are beautiful but are they also meaningless? The infographics in New York are sometimes the former, but never the latter.
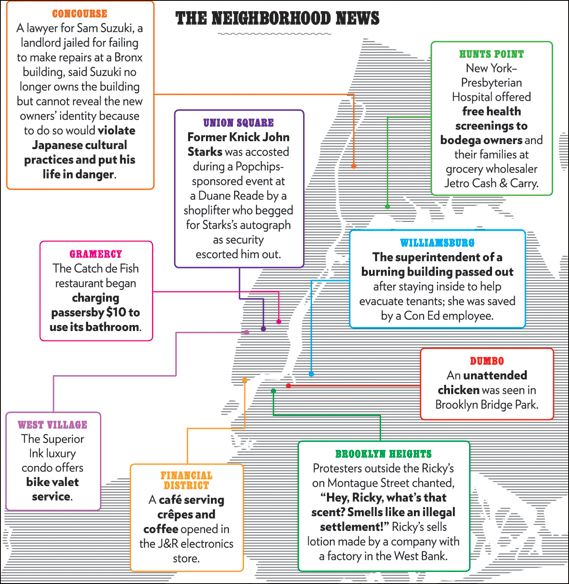
What sets New York's infographics apart (created by the design department under design director Chris Dixon) is that they combine journalistic rigour with design excellence in almost equal measure. A particular favourite is regular feature The Neighbourhood News. A map of New York is annotated with short news stories from different boroughs across the city, neatly encapsulating its diverse nature: an Upper West Side lady reports the theft of $1 million worth of jewellery from her apartment while, in outlying Soundview, police remove a three-foot-long snake from a man's bathroom.


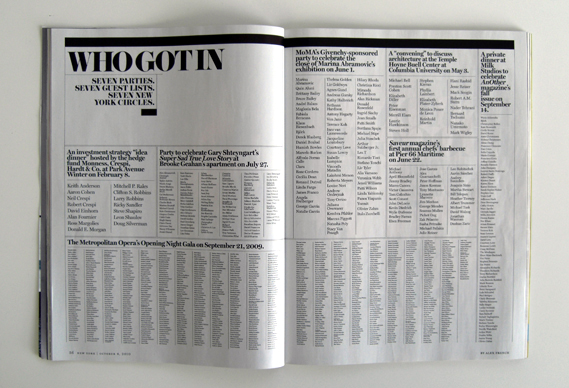
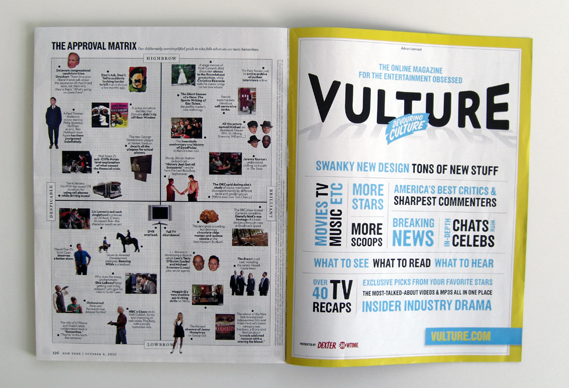
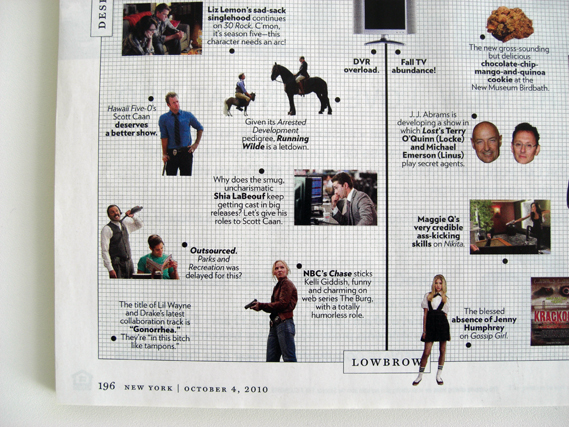
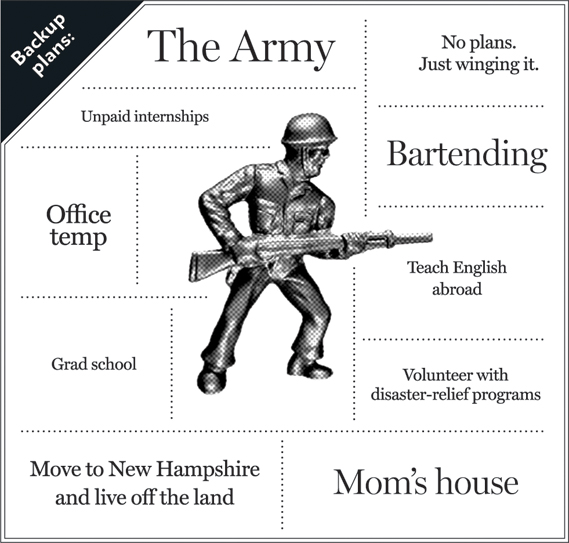
Elsewhere, infographics are used to illustrate and explain features and news stories, adding rather than merely decorating. Sometimes a whole spread will be devoted to data, such as Who Got In (above from the 4/10/10 issue), a recent piece on the Manhattan social scene that simply listed the guests at all the biggest parties in one week. And they are frequently funny, especially The Approval Matrix "our deliberately oversimplified guide to who falls where on our taste hierarchies".


Thursday, 21 October 2010

Information Graphics

Yesterday I came across a wonderful piece of information graphics about the evolution of the Geek. The piece is designed by Dan Martell. It is a wonderfully illustrated and humourous piece! View the full size here


I thought it would be fitting to put a piece of my own Information Graphics. It is a project called 
"The Colours of Me". This Information Graphics piece focuses on the colours in my wardrobe. One version is jacket shaped which hangs on its own hanger and features a cardboard cut out of myself with clothes that fit onto it.